This is a quick way to do the Hour of Code in your class and still meet specific Math expectations in your classroom. There are a ton of terrific coding activities online, this is just my contribution.
Snowman Dash!

After we coded the game I saw how it would relate to Probability in my Elementary classroom.
1. How long can your Snowman survive the game?
2. How could you change the code in the game to make it easier, or harder to survive.
3. Write down how you changed the game and share with your classmates.
Next I thought about how we could graph the results, so I built this simple Pictograph in Scratch:
Building a Pictograph
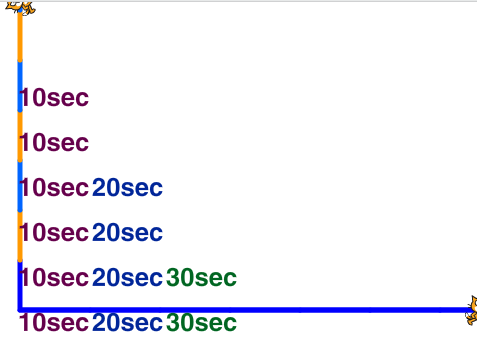
Now students could add to the code to graph the data they gather collected when we played the "Snowman Dash!" game.
You can change the sprites that move up the graph to match any data you collect in your class as you work on Data Management.
Happy coding!
No comments:
Post a Comment
Note: only a member of this blog may post a comment.